
Abortion data just released by the Centers for Disease Control (CDC) reveals that the number of reported abortions dipped slightly (2.27 percent) from the previous year. In 2015, 638,169 abortions (down from 652,639 in 2014) were reported to CDC from 49 reporting areas excluding California, Maryland and New Hampshire. The abortion rate also decreased from 12.1 in 2014 to 11.8 in 2015.
The CDC estimates that, in 2015, 18% of all pregnancies in the United States ended in induced abortion, according to the most recent national estimates from 2010.
Highlights from the report, published November 23, 2018, are below.
Previous live births/abortions in 2015:
- Women with one or more previous live births accounted for 59.3% of abortions.
- Women with no previous live births accounted for 40.7% of abortions.
- Women with three or more previous births accounted for 14.2% of abortions.
- Women with one or more previous induced abortions accounted for 43.6% of abortions.
- Women with no previous abortion accounted for 56.3% of abortions.
- Women with three or more previous abortions accounted for 8.2% of abortions.
Race/ethnicity (30 reporting areas, Percentage based on 353,128 abortions):
In 2015’s report, the CDC noted that minorities are still having abortions at a higher rate, writing, “abortion rates and ratios remained 1.5 and 1.3 times higher for Hispanic compared with non-Hispanic white women and 3.6 and 3.5 times higher for non-Hispanic black compared with non-Hispanic white women.”
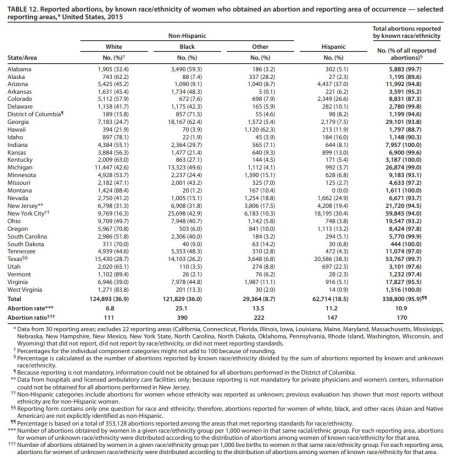
2015 Abortion stats by race (Image: CDC )
Non-Hispanic white women, 36.9% in 2015 (down from 38.0% in 2014)
- Abortion rate of 6.8 abortions per 1,000 women aged 15–44 years.
- Abortion ratio: 111 abortions per 1,000 live births.
Non-Hispanic black women, 36.0% in 2015 (same as 2014):
- Abortion rate: 25.1 abortions per 1,000 women aged 15–44 years.
- Abortion ratio: 390 abortions per 1,000 live births.
Hispanic women, 18.5% in 2015 (slight increase from 18.3% in 2014):
- Abortion rate: 11.2 abortions per 1,000 women aged 15–44 years.
- Abortion ratio: 147 abortions per 1,000 live births.
READ: Shock: More than half of abortions in Medicaid-coverage states are taxpayer funded
Gestational Age of abortions reported in 2015 (excluding 12 reporting areas):
- 8 weeks or less: 279,999 (65.4%)
- 9-13 weeks: 109,860 (25.7%)
- 14-15 weeks: 15,146 (3.5%)
- 16-17 weeks: 9,030 (2.1%)
- 18-20 weeks: 8,410 (2.0%)
- 21 weeks or greater: 5,597 (1.3%)
According to these numbers, 8.9% of children aborted in 2015 — 38,183 — were past the first trimester of pregnancy.
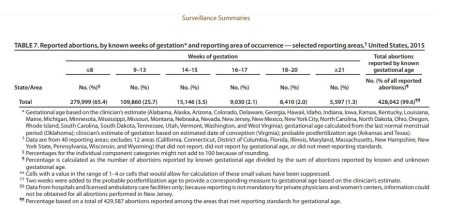
2015 Abortion by gestation selected reporting areas CDC (Image: CDC)
California, Connecticut, the District of Columbia, Florida, Illinois, Maryland, Massachusetts, New Hampshire, New York State, Pennsylvania, Wisconsin, and Wyoming did not report abortions by gestation.
CDC abortion numbers are generally much lower than numbers released by Planned Parenthood’s former “special affiliate,” the Guttmacher Institute. Live Action News has previously explained some of the reasons for the variation:
- The CDC gathers information from states which require reporting; however, the CDC admits that “although reporting to CDC is voluntary, most reporting areas provide their abortion numbers.”
- Guttmacher gathers its figures from surveys which it claims it sends directly to all known abortion facilities, categorized by type.
According to Dr. Michael New’s analysis of the CDC report published at National Review Online (emphasis added):
The new data also demonstrate the weak abortion-reporting requirements in the U.S. The CDC doesn’t have the authority to compel states to report abortion numbers and as a result, unsurprisingly, the data are incomplete.California, Maryland, and New Hampshire all failed to report abortion data for 2015. In fact, California has not reported any abortion data to the CDC since 1997. What’s more, while the CDC has already released 2017 data on a range of public-health topics, its abortion numbers are far behind; there is almost always a lag of more than two years before abortion data is released.
Although Guttmacher has not yet released data for 2015, reported abortion numbers published by Guttmacher in 2014 showed that 926,200 were reported, and revealed that more than 100,000 abortions took place in the 2nd and 3rd trimesters. This reveals a stark difference between CDC and Guttmacher data.
Medical abortions in 2015 (43 reporting areas):
Since the FDA extended the gestational age limit for medical abortion to 70 days, the CDC says, “The percentage of abortions at 9 weeks’ gestation reported as medical has increased… (from 5.0%–7.7% during 2011–2014 to 13.0% in 2015).”
According to the CDC, an abortion is defined as legal only “if it is performed by a licensed clinician within the limits of state law.” It is unclear how CDC will calculate so-called “self-managed” abortions currently being pushed by the abortion industry.
Abortion deaths in 2015:
Tragically, every abortion ends the life of an already developing preborn child, and in some instances, the life of the pregnant woman as well. According to the CDC, “Deaths of women associated with complications from abortion for 2015 are being assessed as part of CDC’s Pregnancy Mortality Surveillance System. In 2014, the most recent year for which data were available, six women were identified to have died as a result of complications from legal induced abortion.”

Photo via Operation Rescue
Pro-life groups previously discovered the death of one of those women from 2014. Lakisha Wilson died from cardiopulmonary arrest during a legal abortion at Preterm in Cleveland, Ohio.
Women are frequently told that when abortions are legal, they are also safe. Unfortunately, abortion consent forms the industry requires women to sign show this is not always the case.
Over past years, due in part to the many efforts of pro-life advocates, published abortion numbers have been steadily decreasing. According to the CDC report, “From 2006 to 2015, the total number of reported abortions decreased 24% (from 842,855), the abortion rate decreased 26% (from 15.9 abortions per 1,000 women aged 15–44 years), and the abortion ratio decreased 19% (from 233 abortions per 1,000 live births).”
Abortion complications — including those resulting from the abortion pill — are only required to be reported by about half of U.S. states.
While the trajectory is heading in the right direction, there is still much work to be done to make abortion unthinkable and return protection to persons in the womb.
-
- This article is reprinted with permission. The original appeared here at Live Action News.
NOTE: (SAYNSUMTHN ADDS: )
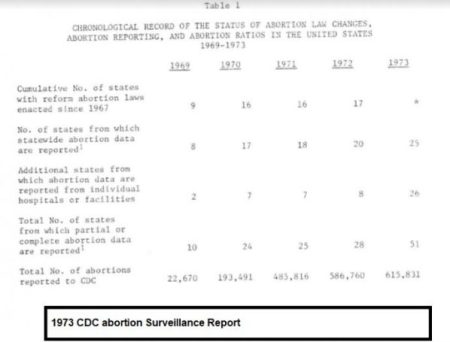
CDC: Reported Abortions 1969 to 1973

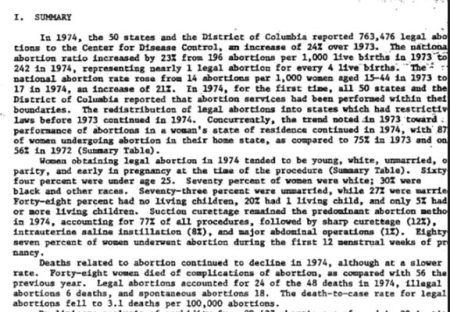
CDC Abortion report 1974
CDC Abortion rate 1973 and 1974
- 2015: 11.8 abortions per 1,000 women aged 15-44
- 2014: 12.1 abortions per 1,000 women aged 15-44
- 1974: 17 abortions per 1,000 women aged 15-44
- 1973: 14 abortions per 1,000 women aged 15-44
